


So, you’re thinking about getting serious with your running, huh? That’s awesome. One of the best ways to actually see how far you’ve come and where you’re headed is by using a running log template. It’s not just about jotting down miles; it’s about building a record that helps you track running performance over time.
Think of it as your personal running diary, but way more organized.
Why Use A Running Log Template?
Honestly, it’s easy to forget the details of your runs after a while. Was that a good run? Did you feel strong? How fast were you really going? A template helps you capture all that. It gives you a clear picture of your progress, which is super motivating.
Seeing those numbers improve, or even just noticing consistency, can make a big difference. It’s also great for spotting when things aren’t going so well, so you can figure out why before it becomes a bigger problem.

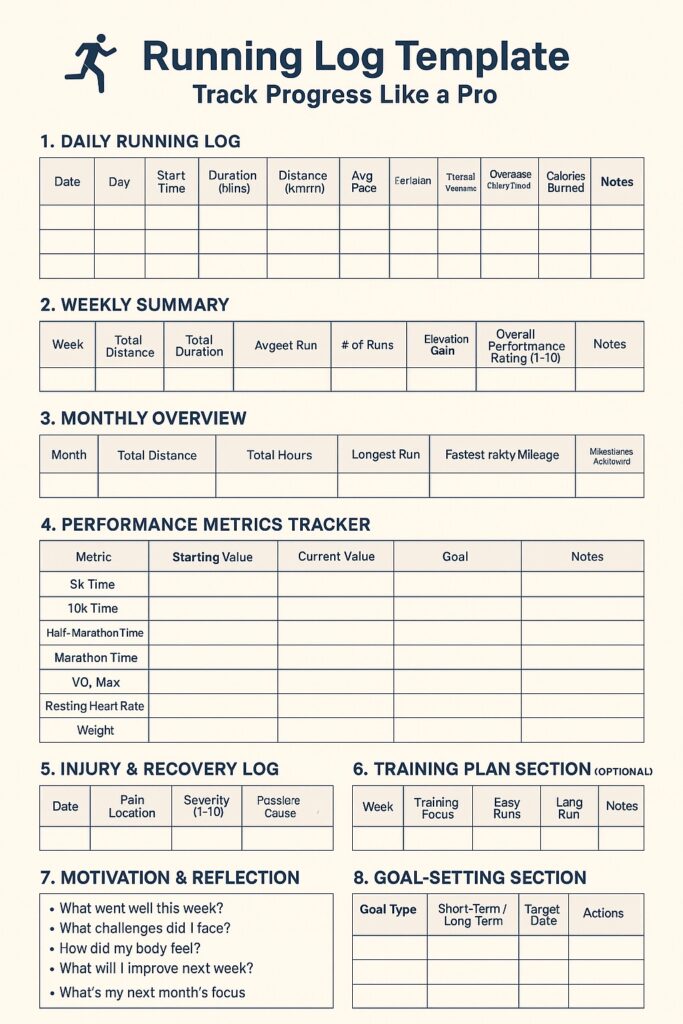
Key Components Of A Running Log
What should you actually put in there? It varies, but most good logs include a few core things:
- Basic Run Info: Date, time of day, duration of your run.
- Distance Covered: How far did you go?
- How You Felt: A quick note on your energy levels, any aches or pains.
- Run Type: Was it an easy jog, a long run, speed work, or a race?
Choosing The Right Running Log Template
There are tons of templates out there, from simple printable sheets to fancy spreadsheets. Some are really basic, just asking for date and distance. Others get more detailed, asking about your heart rate, pace, weather conditions, and even what shoes you wore.
The best one for you is the one you’ll actually use. If you’re just starting, a simple one is probably best. If you’re training for something specific, you might want one with more fields to track details that matter for your goals.
Essential Data To Track In Your Log
So, you’ve got your running log template ready to go. Awesome! But what exactly should you be writing down? It’s not just about jotting down miles; the more detail you include, the more useful your log becomes. Think of it as your running diary, but with a purpose.
Recording Run Details
This is the bread and butter of your log. Every time you head out for a run, you want to capture the basics. This helps you see consistency and the general shape of your running week.
- Date: Obvious, but important. Helps you see your running frequency.
- Distance: How far did you go? Miles or kilometers, just be consistent.
- Time: How long were you out there? This, combined with distance, gives you your pace.
- Run Type: Was it a long, slow run? A quick interval session? A recovery jog? Labeling this helps you understand the purpose of each run.
- Route/Location: Did you run your usual loop, hit the trails, or try a new park? This can be helpful if certain routes feel harder or easier.
Capturing Performance Metrics
Beyond the basic run details, digging into performance metrics gives you a clearer picture of your progress. This is where you start to see if you’re actually getting faster or stronger.
- Pace: This is usually calculated as time per distance (e.g., minutes per mile). Many apps do this automatically, but if you’re logging manually, it’s good to figure it out. It’s a direct indicator of speed.
- Heart Rate (Optional): If you use a heart rate monitor, logging your average or max heart rate for a run can show how hard your body is working. Over time, you might see your heart rate decrease for the same pace, which is a sign of improved fitness.
- Perceived Exertion (RPE): On a scale of 1-10, how hard did the run feel? Sometimes the numbers don’t tell the whole story. A run might have been a certain pace, but if it felt incredibly tough, that’s good information to have.
Noting Environmental Factors
Don’t underestimate how much the world around you can affect your run. Logging these details can explain why a run felt harder or easier than expected.
- Weather: Was it hot, cold, windy, rainy? Temperature and wind can make a big difference.
- Terrain: Were you on pavement, trails, hills, or sand? Different surfaces demand different effort levels.
- Shoes: Which pair of running shoes did you wear? Some shoes are better for certain types of runs, and tracking this can help you understand wear patterns and performance differences.
- Notes/Feelings: This is your space to add anything else. Did you sleep poorly? Are you feeling unusually tired or energetic? Did you have a great conversation with a fellow runner? These qualitative notes add a lot of context to the quantitative data.
Leveraging Your Running Log Template
So you’ve got your running log template set up, maybe it’s a printable running journal or a spreadsheet you downloaded. Now what? It’s time to actually use it to see how you’re doing. This is where the real magic happens, turning a simple record into a tool that helps you get better.
Analyzing Progress Over Time
Looking back at your entries is like looking at a map of your running journey. You can see where you started, where you’ve been, and how far you’ve come. Did you start out barely able to run a mile, and now you’re doing five? Your log will show you that. It’s a great way to stay motivated, seeing concrete proof of your hard work.
Identifying Trends And Patterns
This is where you start to notice things. Maybe you always feel sluggish on Tuesdays, or perhaps your fastest runs happen when the temperature is just right. Your log can reveal these patterns. For example, you might see that your pace drops significantly when you don’t get enough sleep the night before, or that running after a big meal just doesn’t work for you. Paying attention to these details helps you understand your body better.
Here’s a quick look at what you might spot:
- Pace Changes: Are your mile times getting faster over weeks or months?
- Distance Improvements: Are you able to run longer distances than before?
- Feeling: Do you consistently feel stronger on certain days or after specific types of runs?
- External Factors: Does weather, sleep, or diet seem to affect your performance?
Adjusting Training Based On Data
Once you see these trends, you can make smart changes to how you train. If your log shows you’re hitting a wall on long runs, maybe you need to adjust your weekly mileage or add more rest days. If you notice you’re always tired after speed work, perhaps you’re pushing too hard too soon.
This data helps you figure out how to log running workouts more effectively, making your training smarter, not just harder. It’s all about using what you’ve learned from your training log for runners to guide your next steps.
Customizing Your Running Log Template
So, you’ve got a running log template. That’s great! But is it really working for you? A template is just a starting point, right? Think of it like a basic sketch – you’re the artist who adds the color and detail. Making it your own means it’ll actually be useful, not just another thing you feel guilty about not filling out.
Adapting For Specific Goals
Your running log needs to reflect what you’re trying to achieve. Are you training for your first 5K? Maybe you’re aiming to run a marathon next year? Or perhaps you just want to build a consistent habit of running three times a week. Whatever it is, your log should help you see if you’re moving in the right direction.
For example, if you’re training for a race, you’ll want to pay close attention to:
- Long Runs: How far did you go? How did you feel during and after?
- Speed Workouts: What were your intervals? What was your pace during those faster segments?
- Recovery Runs: Were they truly easy? Did they help you feel refreshed?
If your goal is just consistency, maybe you focus more on:
- Days Run: Did you hit your target number of runs this week?
- Duration: Even a short run counts if it keeps the habit going.
- Feeling: A simple “good” or “bad” can tell you a lot about your motivation.
Integrating With Training Plans
Most runners don’t just run randomly; they follow some kind of plan. Whether it’s a downloaded 12-week marathon plan or a schedule you made with a coach, your log needs to line up with it. This is where you see if you’re sticking to the plan and how your body is responding.
Let’s say your training plan calls for a “tempo run” on Tuesday. Your log should have a place to record that specific workout. You’d want to note:
- Workout Type: Tempo Run
- Planned Duration/Distance: e.g., 3 miles
- Actual Duration/Distance: e.g., 3.1 miles
- Pace: What was your average pace for that tempo effort?
- Perceived Exertion: How hard did it feel on a scale of 1-10?
This kind of detail helps you see if you’re hitting the paces required by your plan and if those paces feel manageable or like a struggle. It’s the bridge between your plan on paper and your actual running experience.
Personalizing Your Template
Beyond goals and plans, your log should feel like yours. Think about what information is genuinely helpful to you. Maybe you want to track the weather, the specific shoes you wore, or even what you ate before a long run. Some people like to add a quick note about how they felt mentally that day.
Here’s a simple way to think about adding personal touches:
- Identify Your “Why”: Why are you logging your runs? What questions do you want your log to answer in a few months?
- Brainstorm Extra Data: What else might influence your runs? (e.g., sleep quality, stress levels, diet, hydration).
- Add Columns/Fields: Don’t be afraid to add new columns or sections to your spreadsheet or notebook. If you’re using a digital template, look for options to add custom fields.
For instance, you might add a column for “Energy Level” (1-5) or “Sleep Hours” the night before. It might seem like a small detail, but sometimes these things explain why a run felt amazing or surprisingly tough. It’s all about making the log a true reflection of your running journey.
Advanced Running Log Features
So, you’ve got the basics down with your running log. You’re recording your runs, noting the weather, and maybe even your mood. That’s great! But what if you want to take your running progress tracker to the next level? There are some cool ways to do that, especially if you’re using a spreadsheet or a more advanced app.
Utilizing Spreadsheet Functionality
Spreadsheets are surprisingly powerful for runners. Beyond just listing your runs, you can set them up to do some heavy lifting for you. Think about calculating your average pace automatically for each run, or even your weekly mileage totals.
You can create formulas to figure out your “effort” based on pace and distance, or track how many miles you’ve put on a specific pair of running shoes. It’s like having a little data analyst working for you.
Here’s a quick look at what you might track in a spreadsheet:
| Metric | Example Entry | Calculation/Notes |
|---|---|---|
| Date | 2025-12-01 | Standard date format |
| Distance (Miles) | 5.2 | Actual distance covered |
| Time (HH:MM:SS) | 00:45:30 | Total time for the run |
| Pace (Min/Mile) | 8:45 | Automatically calculated (Time / Distance) |
| Shoe Mileage | 150 | Cumulative miles on current running shoes |
| Perceived Effort | 7/10 | Subjective rating of how hard the run felt |
Incorporating Visualizations And Graphs
Numbers are one thing, but seeing your progress visually is another. Most spreadsheet software lets you create graphs from your data. A line graph showing your weekly mileage over time can really show you if you’re building up your base.
A bar chart comparing your average pace month-to-month can highlight improvements. You can even plot your weight alongside your running volume to see how they interact. Seeing these trends laid out can be super motivating and help you spot things you might otherwise miss.
Tracking Race Performance
When you’re training for a specific race, your log becomes even more important. You’ll want to track not just your training runs, but the races themselves. Record the race date, distance, your finish time, and your overall pace.
You can also add notes about how you felt during the race, what the weather was like, or anything you learned for next time. Comparing your race day performance to your training paces can give you a good idea of how well your training is translating to race conditions. It’s all about building that complete picture of your running journey.