
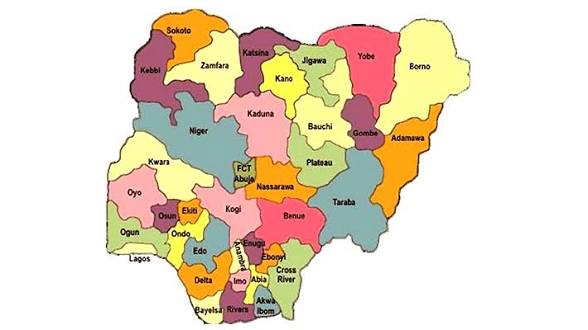
Nigeria’s state debt profile between 2025 to April 2026 has become one of the most closely watched fiscal stories in the country’s economic reality. The numbers reveal a structure that is uneven, concentrated, and deeply tied to how states choose to finance development, politics, and infrastructure at different speeds. While total subnational debt is estimated around 4.0 trillion naira to 4.36 trillion naira based on Debt Management Office releases covering the 2025 to April 2026 cycle, the distribution is what tells the real story. A small group of states holds a very large portion of this burden, while many others operate at relatively low borrowing levels.
The conversation around debt is often misunderstood as simple financial distress, yet the reality is more layered. Some states borrow aggressively because they are building transport systems, housing corridors, industrial zones, and urban expansion frameworks. Others borrow modestly because their revenue base limits access to credit or because their development models are less capital intensive. What emerges is not a uniform national pattern but a sharply divided fiscal map that reflects geography, oil dependency, population pressure, and administrative ambition.
At the center of this structure sits Lagos State, carrying a debt profile that dwarfs most of the federation combined. Around it are oil producing states like Rivers, Delta, and Akwa Ibom, whose borrowing patterns follow cycles of revenue fluctuation and political spending. Then there are emerging industrial and development driven states like Ogun and Enugu, where borrowing is tied to expansion strategies. The remaining group consists of medium and low capacity borrowers whose debt positions reflect limited fiscal space rather than aggressive expansion.
Understanding this structure requires moving beyond surface numbers into how each state builds, spends, and repays. The following breakdown explores the top indebted states in sequence, using figures drawn from 2025 to April 2026 Debt Management Office reporting cycles, while also explaining the fiscal behavior behind each profile.
LAGOS STATE DEBT LEADERSHIP PRESSURE POINT
Lagos State remains the most indebted subnational entity in Nigeria with debt levels estimated between 1.04 trillion naira and 1.22 trillion naira within the 2025 to April 2026 reporting cycle. This places the state at approximately 27 percent of total state level debt across the federation. The scale is significant not only in absolute numbers but in what it represents about Nigeria’s urban financial structure.
A large portion of this debt is tied to infrastructure expansion that spans transport corridors, housing developments, road rehabilitation, and urban mass transit investments. Lagos operates as a megacity with population pressure that demands continuous capital projects, and borrowing becomes one of the few tools available to match infrastructure needs with population growth. The Lagos economic structure, supported by internally generated revenue, allows it to access larger credit windows compared to most other states.
Debt servicing capacity in Lagos is also stronger than most states due to its diversified economy which includes trade, services, taxation systems, and port related revenue streams. This allows the state to maintain borrowing levels that would otherwise be unsustainable in less economically active regions. However, the scale of borrowing also reflects how expensive urban governance becomes when population density and infrastructure gaps increase simultaneously.
Between 2025 and April 2026, Lagos continued to channel borrowing into long term projects that extend beyond electoral cycles. These include road networks connecting industrial zones, housing schemes aimed at population pressure, and transport infrastructure aimed at reducing congestion. The debt profile therefore reflects a structural reality rather than short term fiscal imbalance.
RIVERS STATE OIL ECONOMY BORROWING STRUCTURE
Rivers State holds the second largest debt position in Nigeria with estimated liabilities between 364 billion naira and 381 billion naira. The state’s economic identity is heavily tied to oil production, yet its fiscal behavior shows consistent reliance on borrowing for infrastructure and administrative expansion.
Port Harcourt remains a central urban hub that requires continuous infrastructure maintenance and modernization. Roads, bridges, public buildings, and energy related projects dominate the state’s capital expenditure cycle. These commitments often exceed immediate revenue inflows, creating a borrowing pattern that aligns with oil revenue volatility.
Political cycles also influence borrowing behavior in Rivers State. Large scale development projects often align with administrative priorities, leading to periods of increased borrowing followed by stabilization phases. This cyclical pattern creates a debt profile that is not static but responsive to both economic and political shifts.
Between 2025 and April 2026, Rivers State continued investment in urban renewal projects and infrastructure rehabilitation. Despite its oil wealth, the state maintains a borrowing position that reflects both ambition and structural spending obligations tied to its urban and industrial identity.
DELTA STATE FISCAL EXPANSION PATHWAY
Delta State carries debt estimates between 204 billion naira and 248 billion naira within the 2025 to April 2026 fiscal cycle. Like Rivers State, Delta benefits from oil revenue, yet its borrowing profile reveals a sustained focus on infrastructure expansion and regional development initiatives.
The state’s geography includes urban centers, oil producing communities, and rural agricultural zones, all of which require different levels of public investment. This diversity creates pressure on fiscal resources, leading to borrowing for road construction, healthcare facilities, and educational infrastructure.
Delta State also engages in development financing aimed at improving internal connectivity between oil producing communities and administrative centers. These projects are often capital intensive and long term, requiring borrowing beyond annual revenue cycles.
Between 2025 and April 2026 reporting cycles, Delta’s debt behavior remained consistent with its historical pattern of moderate to high borrowing supported by oil revenues. The state continues to balance revenue inflows with infrastructure needs that span multiple sectors of its economy.
ENUGU STATE INFRASTRUCTURE MODERNISATION TRAJECTORY
Enugu State records debt levels between 157 billion naira and 194 billion naira during the 2025 to April 2026 period. The borrowing profile reflects a strong focus on modernization of infrastructure, urban development, and administrative restructuring.
The state capital has undergone significant transformation efforts aimed at improving road networks, public transportation systems, and urban planning frameworks. These projects require sustained capital injection which often exceeds immediate internal revenue capacity.
Enugu’s borrowing behavior also reflects its position as a regional administrative center in the southeast, where infrastructure expectations are increasing due to population growth and commercial activity. Development financing is therefore directed toward long term urban expansion.
Between 2025 and April 2026, Enugu maintained steady borrowing levels aligned with its development agenda. The debt profile suggests strategic investment rather than reactive fiscal stress, although revenue constraints remain a limiting factor.
OGUN STATE INDUSTRIAL EXPANSION BORROWING MODEL
Ogun State shows debt estimates between 162 billion naira and 227 billion naira. The state’s proximity to Lagos has positioned it as an industrial expansion corridor, leading to significant infrastructure development borrowing.
Industrial estates, manufacturing zones, and transport corridors dominate Ogun’s development agenda. These require large scale capital investment in roads, energy infrastructure, and logistics systems. Borrowing becomes essential to sustain industrial attractiveness.
The Lagos Ogun economic corridor has also increased land value pressure and urban expansion, leading to infrastructure demands that exceed annual revenue inflows. Ogun’s debt therefore reflects its role as an extension of Nigeria’s largest urban economy.
Between 2025 and April 2026, Ogun continued to channel borrowing into industrial and transport infrastructure, reinforcing its position as a manufacturing gateway state.
BAUCHI STATE DEVELOPMENT FINANCING DEPENDENCY
Bauchi State records debt between 143 billion naira and 158 billion naira. The borrowing pattern reflects strong dependence on federal allocations combined with development financing for infrastructure projects.
The state’s large geographic size requires significant investment in roads, healthcare access, and education infrastructure. These needs create recurring pressure on fiscal resources, leading to structured borrowing.
Agricultural potential also drives investment in rural infrastructure, irrigation systems, and market access roads. These capital projects require long term financing solutions.
Between 2025 and April 2026, Bauchi maintained a borrowing profile consistent with development focused expenditure rather than industrial expansion.
NIGER STATE POWER INFRASTRUCTURE FINANCING
Niger State carries debt levels between 141 billion naira and 143 billion naira. The state’s borrowing is heavily tied to infrastructure and energy related projects, particularly around power generation and distribution systems.
Geographic size and low population density create unique infrastructure challenges, requiring extensive road networks and energy distribution investments. These factors drive borrowing needs.
Between 2025 and April 2026, Niger State maintained stable debt levels focused on long term infrastructure rather than rapid expansion cycles.
CROSS RIVER STATE TOURISM INFRASTRUCTURE PRESSURE
Cross River State shows debt estimates between 137 billion naira and 147 billion naira. Borrowing is strongly linked to tourism infrastructure and legacy development projects.
Projects tied to tourism development require high capital investment with long return cycles, making borrowing a necessary fiscal instrument. Urban renewal and hospitality infrastructure also contribute to debt accumulation.
Between 2025 and April 2026, Cross River maintained development focused borrowing despite revenue limitations from tourism fluctuations.
BENUE STATE AGRICULTURAL ECONOMY CONSTRAINTS
Benue State carries debt between 107 billion naira and 133 billion naira. The borrowing profile reflects an agricultural economy with limited internal revenue generation capacity.
Infrastructure needs are driven by rural connectivity, market access roads, and agricultural support systems. These require external financing due to limited fiscal base.
Between 2025 and April 2026, Benue maintained moderate borrowing levels aligned with its agricultural development structure.
AKWA IBOM STATE INFRASTRUCTURE BALANCE MODEL
Akwa Ibom State records debt between 95 billion naira and 105 billion naira. Despite strong federal allocations from oil revenue, the state maintains borrowing for infrastructure expansion.
Projects include road networks, urban development, and public facilities. The borrowing profile reflects a balance between revenue inflow and development ambition.
Between 2025 and April 2026, Akwa Ibom maintained controlled debt levels compared to other oil producing states.
CONCLUSION: STRUCTURAL DEBT REALITY NIGERIA
Nigeria’s state debt structure between 2025 to April 2026 reveals a system defined by inequality in fiscal capacity, development ambition, and revenue generation. Lagos dominates due to scale and economic complexity, oil states follow with cyclical borrowing patterns, while industrial and developing states maintain steady infrastructure driven debt.
The overall pattern shows that debt is not simply a marker of financial stress but a reflection of how each state responds to development pressure. The concentration of nearly 70 percent of total subnational debt within a small group of states highlights the uneven nature of Nigeria’s fiscal geography.
What emerges is a layered financial system where borrowing is both a tool of development and a mirror of structural imbalance across the federation.